One of the most frequently asked questions we get from our customers at Retently is “What is a good Net Promoter Score®?”. Although we emphasize that the score value is irrelevant, we do understand that comparing the metric to other companies can help gain a more accurate picture of where they stand in the competitive landscape.
To be honest, benchmarking NPS® is a complicated process. Behind every customer satisfaction metric, there is a series of factors that influence it. NPS is no different.
To prove that, let’s look at the following examples. According to Retently’s NPS data for a five-year span, the average Net Promoter Score for Healthcare lies in the range of 34 with the lowest having a value of 20, while the average NPS for Communication & Media – in the range of 19, with the lowest being -6.
It essentially means that you cannot say a lot about a company just by looking at its absolute NPS without considering its relative performance within the industry. While for some businesses, an NPS of 30 might turn out to be the worst in the industry, for others – as being ranked among the market leaders.
So, from what you can see, the Net Promoter Score can vary dramatically, and if you want to figure out whether your NPS score is good or bad, there are a variety of aspects to dig into. Further on, we will be looking at the absolute values of a good Net Promoter Score across industries, factors affecting NPS benchmarks, and steps to take when comparing your scores against competitors to get the most out of your NPS score.
But, first things first, so let’s make sure there is a clear understanding of what NPS is.
Net Promoter Score Defined
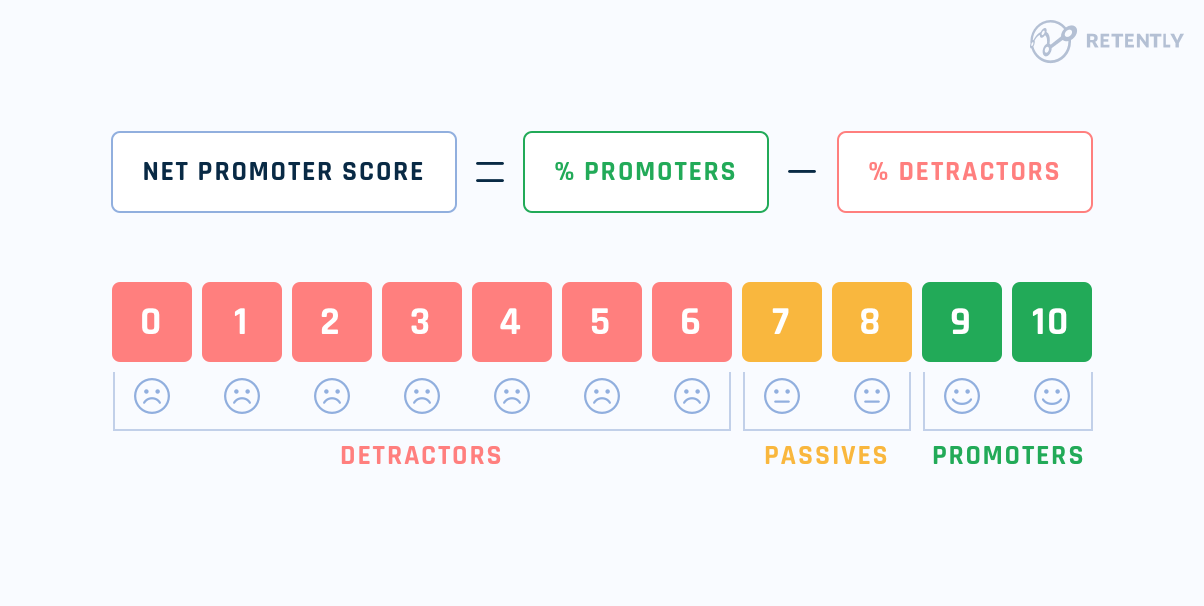
Net Promoter Score (NPS) is a simple, yet effective metric that measures customer satisfaction and loyalty by asking one key question: “How likely are you to recommend our company/product/service to a friend or colleague?”. Based on their responses, customers are grouped into Promoters, Passives and Detractors, with NPS being the difference between the percentage of Promoters and Detractors.
- Promoters (9-10): Loyal enthusiasts who will most likely recommend your business to others and help attract new customers.
- Passives (7-8): Although satisfied, these customers are not devoted to your brand and may easily switch to a competitor if a better offer is on their radar.
- Detractors (0-6): Unhappy customers who may affect your business reputation and growth through negative word-of-mouth.
The concept of NPS was first introduced in 2003 and, since then, has become a key reference point for businesses aiming to improve the customer experience. Here’s why:
- Simplicity – NPS is easy to understand, implement and act upon. This straightforward nature makes it an accessible metric for companies of any size and industry.
- Actionability – Companies can use NPS to uncover opportunities to improve, efficiently target specific customer segments and turn at-risk customers into brand ambassadors. The metric also serves as a gauge for the overall health of customer relationships.
- Predictive value – Linked to customer loyalty and positive word-of-mouth, a high NPS suggests a potential for greater customer retention and more revenue for the business, predicting future growth.
- Benchmarking – NPS offers a means to compare performance against industry standards and competitors, in order to identify trends over time and facilitate informed decision-making.
Retently 2024 NPS benchmarks
We often outlined the importance of benchmarking NPS to make it work to one’s benefit. We used various sources to pinpoint the idea and bring about representative examples. But why use only external sources to surface specific conclusions when we have plenty of examples of our own?
With this idea in mind, we took a step forward to our objective. We needed to have a glance at our own customers and sort out the conglomerate of data to shape the Retently 2024 NPS Benchmark. With a large customer base from various industries, here’s how we selected the data to keep it objective and reduce the margin of error:
- we included only industries with more than 10 clients
- the data comes from a sample of at least 10,000 surveys
- the companies were not segmented by size or country as it did not fit the scope of these benchmarks
By looking into the NPS scores of the respective customers, we came up with an average value for each of the industries fitting the rule.
The aggregated data across our customers have led to surprising results: all of the analyzed industries crossed the zero threshold. Since none of the rated companies dipped into the negative NPS field, overall, we could witness an average score ranging from 16 to 80.
For a more vivid display, we decided to group our data into B2B and B2C companies. But before drawing up any conclusions, let’s dive into the numbers:
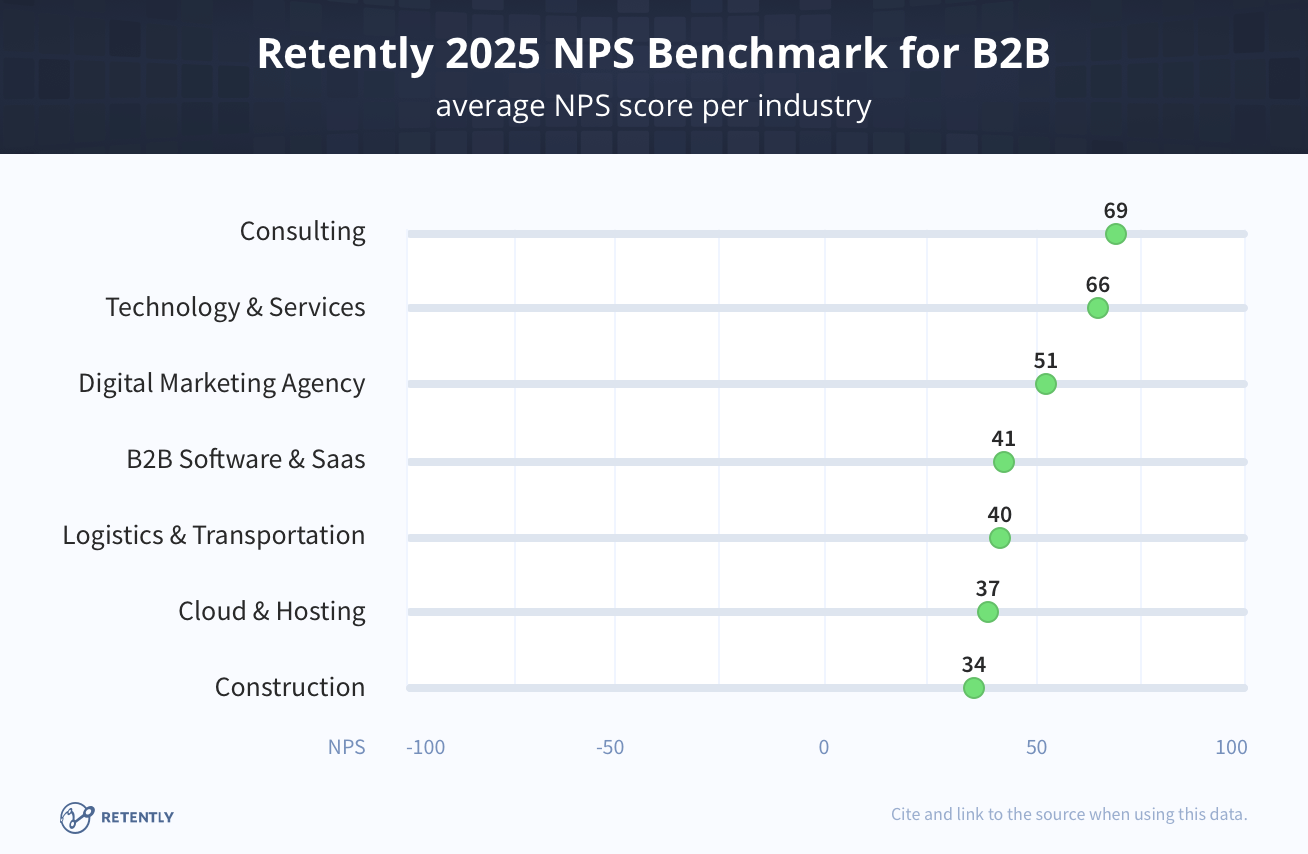
Thus, we’ve got the Insurance industry leading the pack with an impressive average of 80. After experiencing a decline last year following four years of continuous growth, the Consulting industry is getting back on track with an NPS score in the high 70s. Financial Services secured a spot in the top 3 rankings, boasting an NPS score of 73.
In 2022, Ecommerce, Retail and Technology & Services considerably strengthened their positions, registering a notable jump compared to 2021. The high-stakes reality imposed new standards, to which these companies successfully adapted. However, in 2023, only Technology & Services and Retail advanced on the NPS scale or stuck to their positions, while Ecommerce registered the second lowest value for the industry over a 5-year period with an NPS score of 50.
Yet, 2024 comes with new opportunities for Ecommerce and Retail, with more and more brands adopting CX tools willing to leverage customer feedback for relevant improvements. This has been reflected in their numbers with an increase to an NPS score of 52 and 64, respectively. Technology & Services have experienced one of the most steady growths over the years, but unfortunately, 2024 was less generous, in spite of a quite good score of 61.
These industries, together with Digital Marketing Agencies present on our chart, prove that an average NPS score over 50 is achievable if a customer-centric approach is adopted. Since a single negative experience is all it takes to turn a potential Promoter into a Detractor, brands have learned to pay due attention to each customer interaction and act quickly to embrace change. The numbers speak for themselves.
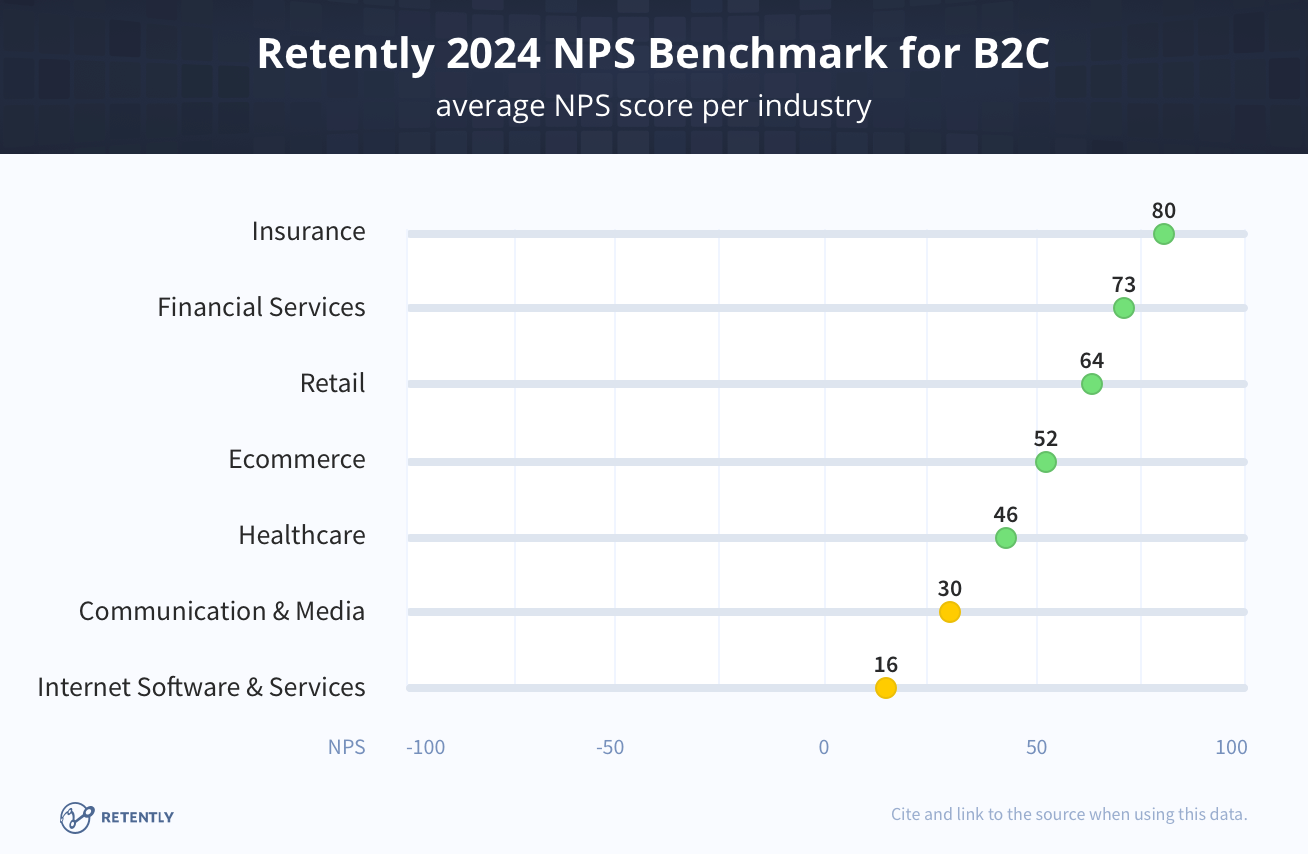
We move toward Healthcare companies that enjoy a convincing average NPS in the high 40s, while B2B Software & SaaS and Logistics & Transportation companies account for a slight decrease to an NPS score of 40.
The Construction industry experienced the most dramatic change in 2024 with an NPS score of 37 (-23 points), being unable to maintain the impressive value from 2023.
The Cloud & Hosting industry seems to hold on to a quite decent score of 39, while Internet Software & Services, although at the end of the scale, registered a positive value of 16.
Drawing a line under the numbers, we can outline the following highlights:
- According to the aggregated data, the average Net Promoter Scores for B2B industries range from 39 to 76, while for B2C, from 16 to 80. One can notice that for B2C markets, the gap between the highest and lowest score is more considerable than in the case of B2Bs.
- The top value of the NPS benchmarks reported a 6-point increase compared to the previous year, while the lowest score had an even better result at plus 7 points.
- Although the industries present in the benchmark enjoy a high average NPS score, the majority have experienced a decline in their numbers during the pandemic years, the most affected being Logistics and Transportation (from 29 to 3), Ecommerce (from 62 to 45), and Insurance (from 70 to 57). While the pandemic changed the game, imposing a new reality, these industries managed to improve their bottom line and come strong with better offers, new customer-centric processes and improved customer experiences – clearly reflected in their 2022 NPS values. In 2023 and 2024, 10 out of 14 industries either registered an increase or saved their spot on the NPS benchmarks, keeping the upward trend consistent.
- The most noticeable boost was registered by the Consulting industry with an increase of 9 points (from 67 to 76), followed by Internet Software & Services companies with 7 points, Insurance and Digital Marketing Agency with plus 6 points. While the growth is not as striking as in the previous years, which featured a 40-point increase, each of these sectors has managed to recover following a less prosperous 2022.
- Although most industries have experienced an increase in their NPS scores, getting back to the pre-pandemic values or even surpassing them, there are sectors that accounted for a significant decline, among which are: Construction, Technology & Services, B2B Software & Saas and Logistics & Transportation.
- The pandemic has brought into sight more digital presence with Cloud & Hosting, Technology and Services, B2B Software, Digital Marketing Agencies, and Ecommerce earning the mid-values in our NPS benchmark. According to Zendesk, 75% of decision-makers confirmed that COVID accelerated the adoption of digital technology. Since expectations are high, even seemingly the most adjustable industries have not been spared a critical eye.
- The pandemic and the subsequent limitations have hit hard such industries as Travel & Tourism, Restaurants and Hospitality, companies which diminished in number and therefore are no longer recurrent in the Retently NPS benchmark. At the same time, we witness such industries as Staffing & Recruitment or Food Takeout & Delivery gaining more attention given the new reality. As expected, as soon as most countries launched their vaccination programs, there was an increase in the average NPS score for most industries, especially Ecommerce and travel-related. Given the considerable focus on environmental aspects, such industries as Renewables & Environment came forth, making it quite possible to earn a respectable place on our NPS benchmarks in years to come.
With all this data in mind you may wonder, what is actually a good Net Promoter Score to have and how can you get a more accurate understanding of where you stand in a particular niche?
Well, it’s about time to get into more details.
What is a good NPS score?
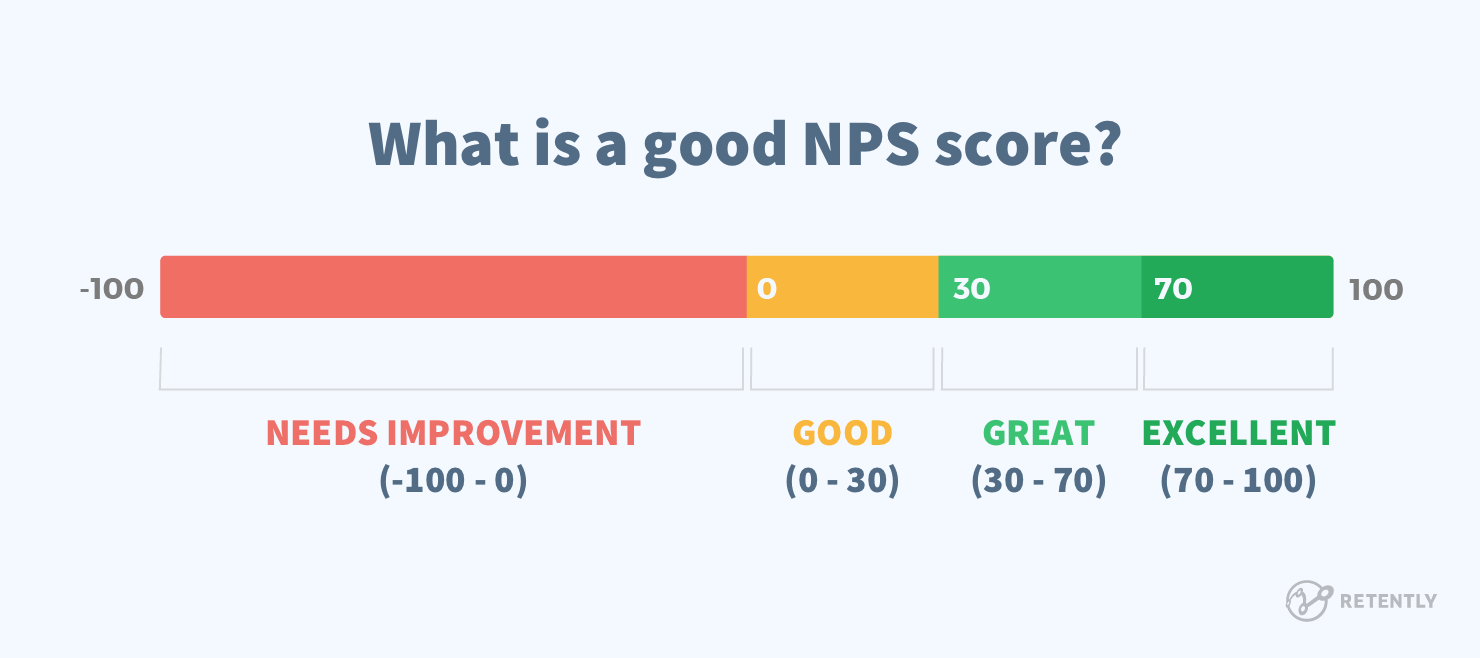
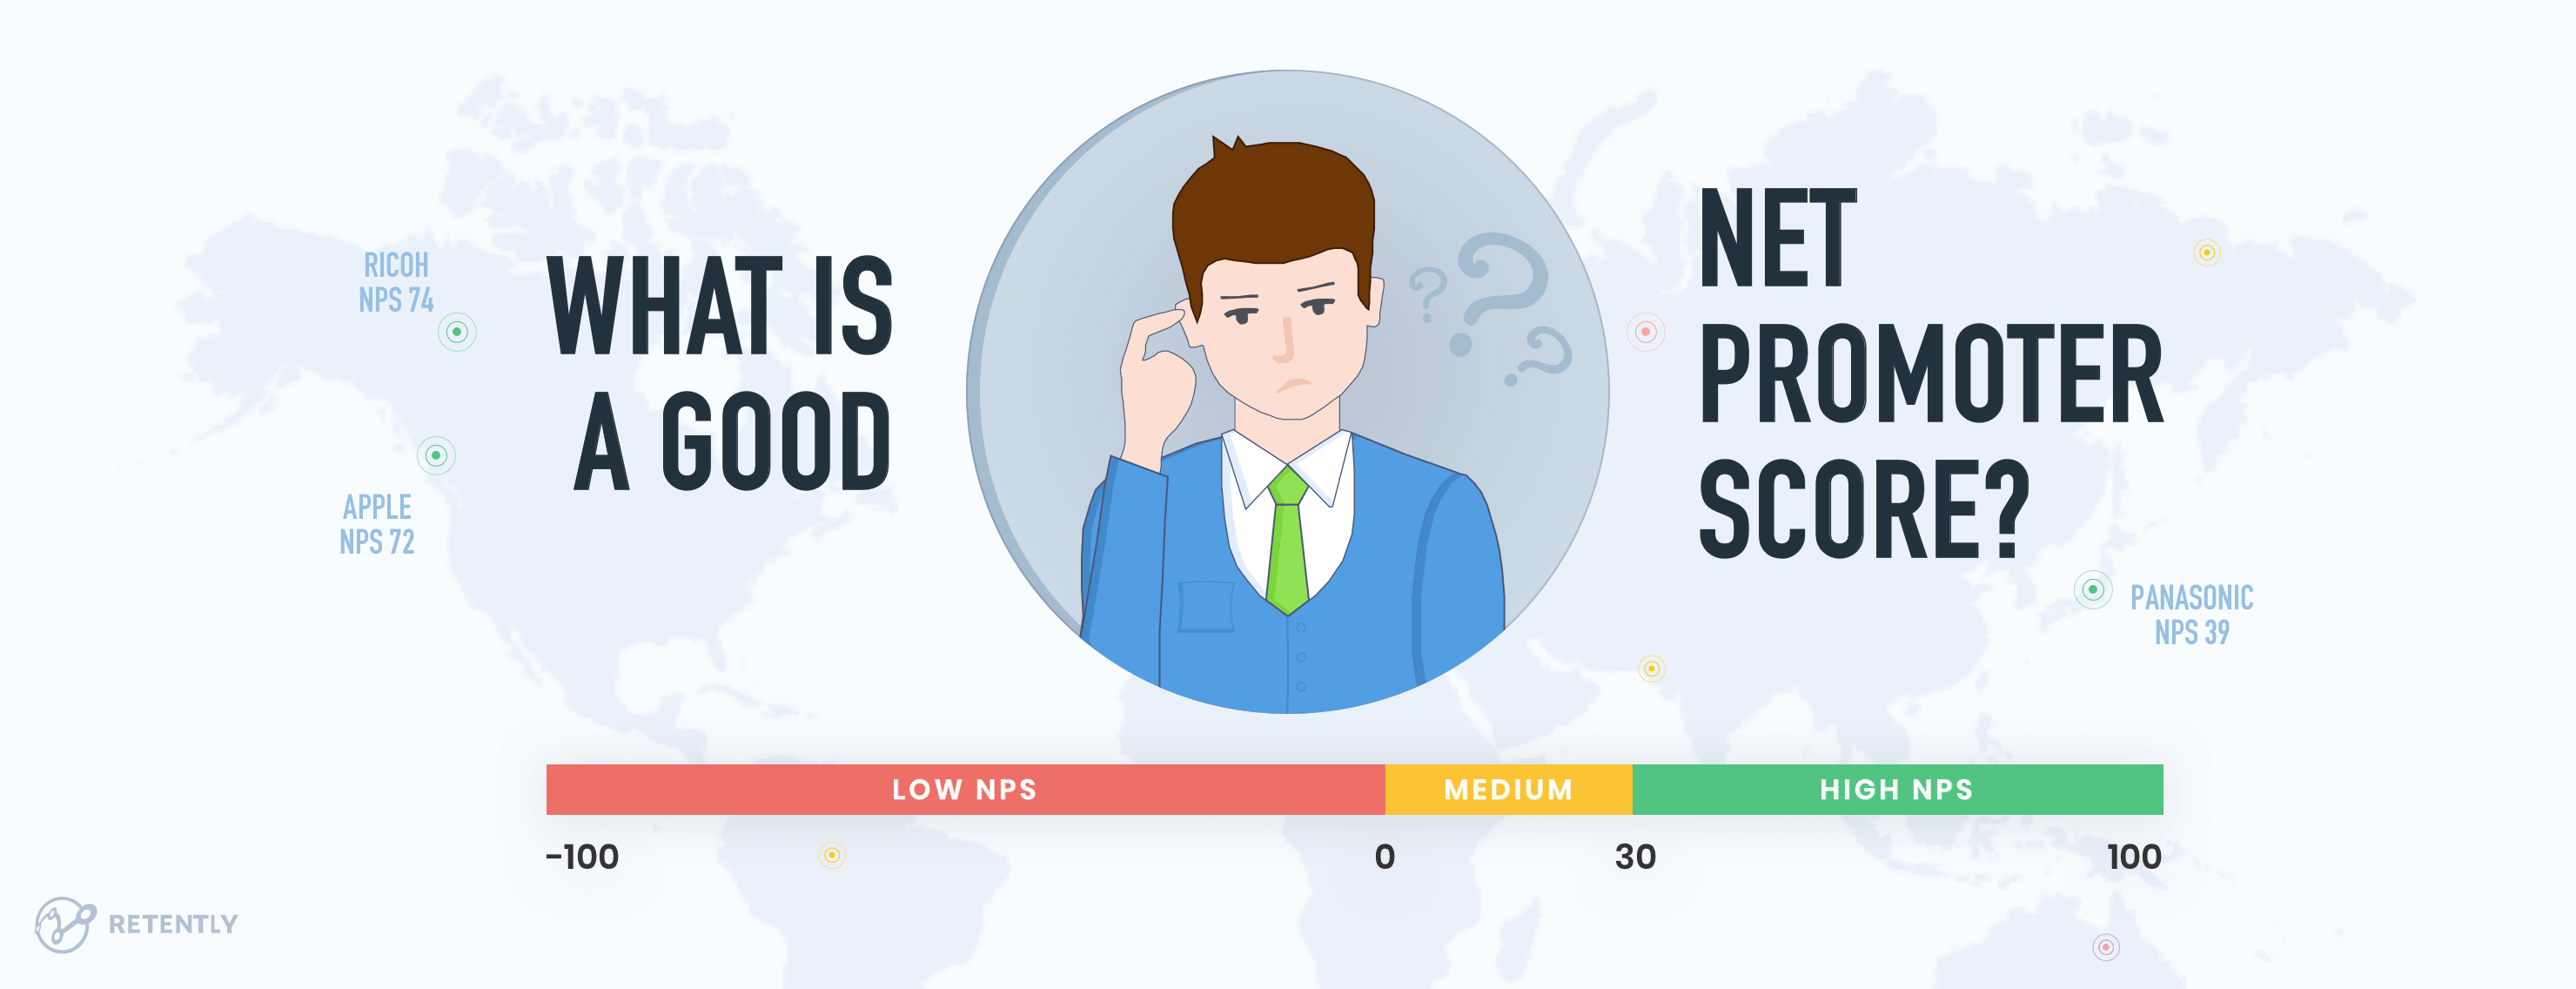
Generally speaking, a Net Promoter Score that is below 0 would be an indication that your business has a lot of issues to address.
A score between 0 and 30 is a good range to be in, however, there is still room for progress. If your NPS is higher than 30, that would indicate that your company is doing great and has far more happy customers than unhappy ones.
An NPS over 70 means your customers love you and your company is generating a lot of positive word-of-mouth from their referrals. The higher your NPS is, the more likely it is that your customer referrals will convert into new leads, hence into more revenue for your company.
Do your best to keep your score above 0. Even though an NPS of -10 might be higher than others in your niche, finding yourself below zero might be discouraging and it should definitely ring a bell as to the provided customer experience.
NPS trend over time
Have you ever thought of how the NPS average value changed over the years?
We did, and it seemed to firmly slide down. To back up our assumption, we looked into the data provided by the Temkin studies for a span of 3 years. As a result, we could witness a clear decrease in the average NPS score provided by consumers for 15 out of 20 industries, with sectors such as Banking, Software and Internet services accounting for a more significant decline.
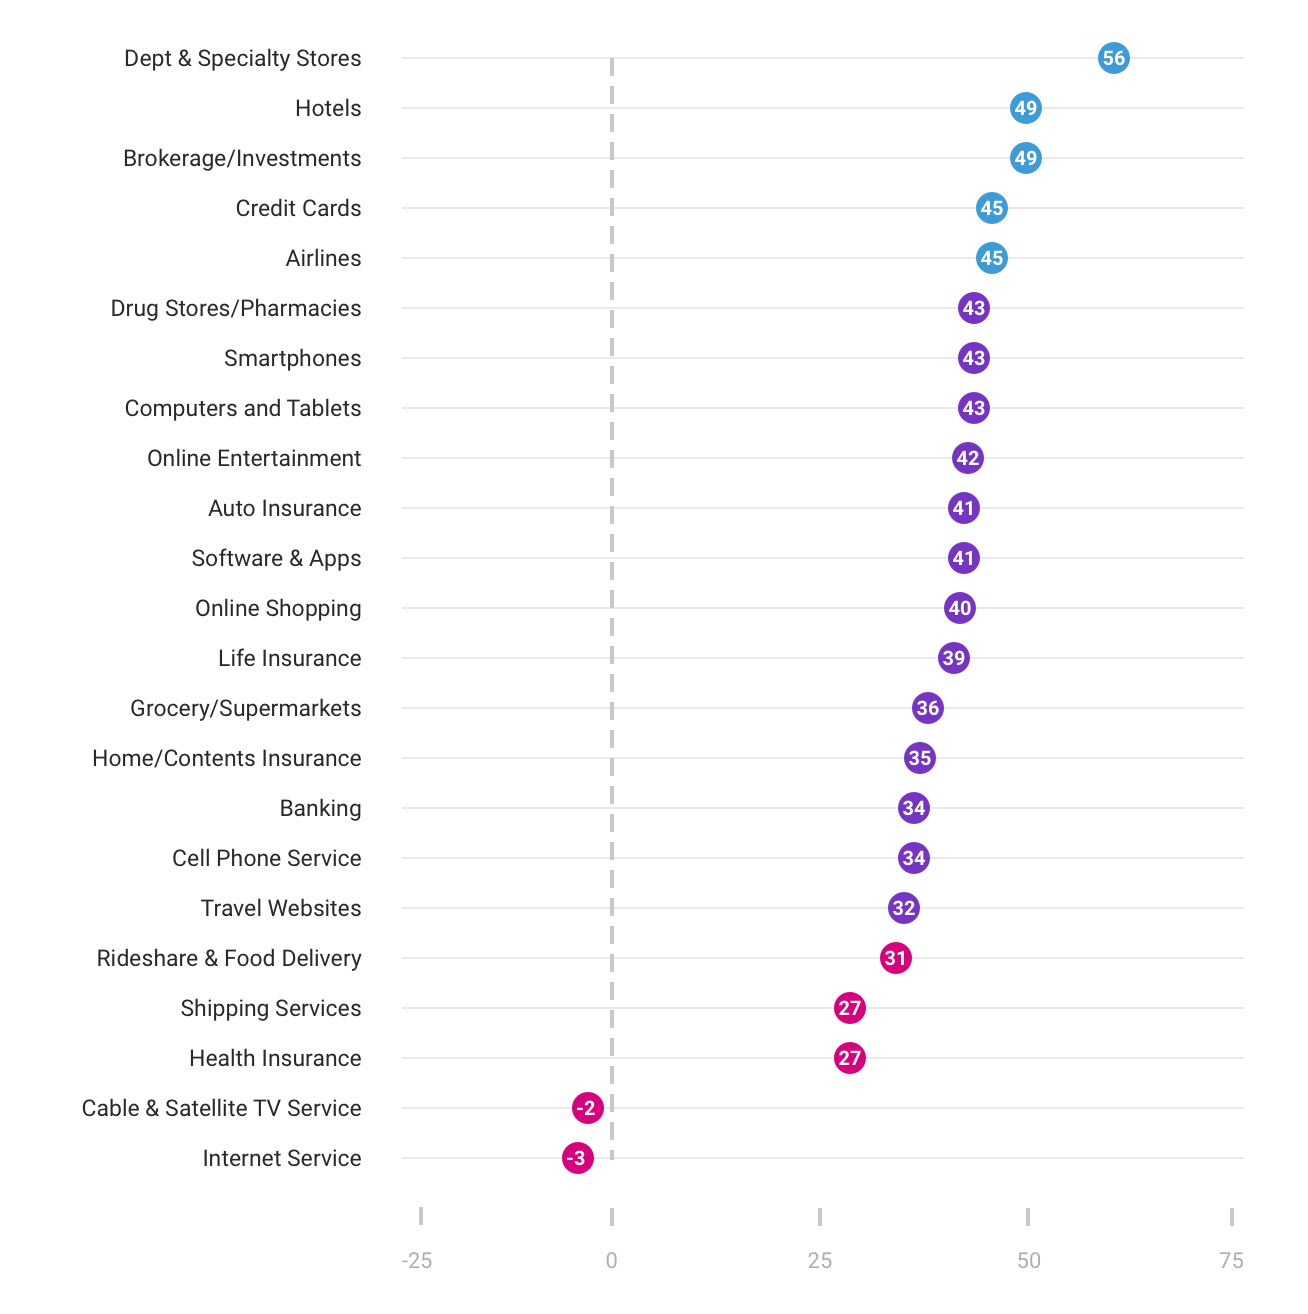
The data reflected in the Satmetrix-NICE NPS benchmark reports for a similar period seems more optimistic, with a clear decline in the received NPS scores for only 12 out of 23 industries, having Cable & Satellite TV and Internet Services at the bottom of the scale. However, what seems encouraging at first sight, is merely a temporary spike in the overall picture. In this context, one should consider that only 2 of the 23 sectors got a slight increase – Health Insurance and Smartphones – while the remaining 9 sectors enjoyed a slight boost in 2018, followed by an even lower average NPS score in 2019 as compared to previous years.
A compelling study in the field, conducted by ProfitWell, supports our observations. By analyzing NPS data in both B2B and B2C from over 5,000 subscriptions and nearly 25,000 consumers, they reached a similar conclusion. Five years ago the average NPS was in the upper 20s and low 30s, today dropping to single digits. The numbers highlight that the average Net Promoter Score is undoubtedly trending down.
What then? We’re past 2019 you would say. Then COVID-19 took the stage, shifting the focus to recovery rather than evolution or change. The pandemic left a noticeable footprint worldwide and NPS scores in most industries simply crashed.
Change is never easy, therefore, companies had to figure out a quick way to adapt to the new reality that would shape their path for years to come. And although in 2022 and 2023, many industries managed to approach the pre-pandemic NPS values, and in isolated cases even achieve better results, it’s rather difficult to follow the overall trajectory of the NPS trend without taking a glance at the performance of the following years.
But still, why the change? Why did the average NPS score drop over the years, irrespective of the industry? It’s definitely not because the current offering is less attractive or quality-oriented, or because the customer support cannot provide a positive customer experience.
We live in times when there is plenty of competition, when providing a product that simply works is not enough, and customer expectations are higher than ever. Coming up with something that will challenge your client’s interest over the entire customer journey is just so much harder.
A memorable customer experience is what makes the difference, driving up a good NPS score. That is why diving into customer feedback in search of meaningful improvements that can impact your brand’s future performance is merely a necessity.
Benchmarking your Net Promoter Score, step by step
The perception of a good NPS and the accuracy of the above score segmentation is very relative. Truth be told, there are markets that never get a Net Promoter Score higher than 20. If you are one of them, there are several steps you need to go through to compare your scores against competitors.
Step 1: Compare it with your industry average
To understand your Net Promoter Score better, start by comparing it with the average scores within your industry, and against competitors. This is also referred to as the relative method, as opposed to the absolute method, which involves benchmarking your number to an agreed standard across industries for what a good NPS is.
When comparing NPS scores, it’s important to understand what market you’re operating in. Some businesses have a more positive image than others. Department stores, for example, bring more happiness to customers than banks and insurance companies. Thus, they tend to have higher NPS.
If you are in a travel business, you can’t compare yourself to a company that provides internet or TV services. It will simply give you the wrong idea.
To prove that, let’s look at the Verizon NPS score, which in 2019 dropped to 19. Considering that the maximum score you can get is 100 (which no company ever did, by the way), you might think that it is pretty low. As a matter of fact, Verizon has had the best score in the ISP industry for years in a row, being overthrown by AT&T Fiber only in 2020 with an NPS score of 20.
United, with an NPS of 10, on the other hand, ranks as one of the worst companies in the Airline industry. In 2021, the company reported an increase in its NPS score throughout the pandemic and later on referred to 2023 as a year of growth and restoration with record NPS scores. However, they have not published the exact numbers of the United NPS survey. While both companies have somewhat similar scores, their performance among peers differs considerably.
NPS shouldn’t be the endpoint of your benchmarking process. Conduct a competitive analysis to significantly broaden your ideas and inspiration base, as well as pinpoint your weaknesses and strengths.
Step 2: Compare the score within a region
NPS varies not only by industry, but also by geographical area.
Cultural differences can influence NPS scores a lot. There is a tendency for different regions to rate companies with varying degrees of enthusiasm. For example, in some countries, customers are less willing to use the top end of any scale, whilst others opt for the extremes, avoiding the middle values.
Anyone who has ever compared NPS scores in the US and Europe probably knows what we are talking about. Europeans rate company performances very conservatively and they are less likely to give you 9s or 10s.
In Europe, children are graded on a scale of 0 to 10 and it’s almost impossible to get a 10. In Europeans’ minds – 8 is good, 9 is great and 10 is genius. So when confronted with a classical 0-10 scale in NPS, survey respondents give you 8 even if they are satisfied.
In Japan, customers tend to give lower ratings as well, since it is considered poor etiquette to rate any business too high or too poor, regardless of their performance. Americans, on the other hand, give higher scores than just about anyone else. And it’s not at all surprising since the Net Promoter System was originally developed in the US.
A recent Global Consumer Study, also showed that along with the US, such countries as Brazil, India, Indonesia and Mexico have a median response of 9 when someone likes a company, which is above the value of the rest of the countries recurrent in the study. In this respect, South Korea and Japan recorded the lowest average scores of 7 and 6, having the smallest NPS gap between when they like and dislike a company.
CheckMarket wrote a compelling article that suggested the need for another NPS survey format for European countries, where respondents who give you 8s would also be considered Promoters. The distribution of NPS scores across countries like France, Germany, Spain and the UK present in the study might give a green light in this respect. We think it’s a great idea, but for now, if you’re not happy with your NPS score, read step three.
Step 3: Consider the survey channel
Pay attention to the differences in the survey channel (email, in-app, SMS) and the methodology used to conduct the survey, since it can have a big impact on the NPS score. Big companies may have the financial means to do an outsourced survey, whereas small companies will most probably measure it on their own.
There is much discussion on the surveying methodologies favored by respondents. Fueled by the growth of the internet, web surveying seems to take the lead. However, criteria such as approach, outreach method, cost, and demographics allow some of the channels to outperform in particular cases.
For instance, the social interaction proper to a phone call may determine more engagement from the respondent since he is assisted in the discussion. It may also affect their answers as people tend to present their opinions in a more positive light to a real person. Web surveys (in-app) turn out to be less expensive, less intrusive, but, at times, they might have a weaker impact on enforcing customer dialogue.
Whatever channel you go for, make sure you run your NPS campaign using the same method as performed by the benchmarked competitor. Otherwise, the comparison will simply not give you accurate results. Don’t compare apples to oranges.
Step 4: Use your baseline NPS as your own benchmark
Since the score alone is nothing but vanity, it’s impossible to give you a certain number that shows you what a good NPS is. The only number that’s good, is the one that’s better than your previous score. That is the most important benchmark.
The best way of measuring progress would be to compare your NPS against your score over the last three or six months. If you notice a 5-10% increase in score, you’re going in the right direction and progressing toward building a successful business.
On the contrary, if you notice a significant decrease in the number, treat it as a warning sign that something went wrong and certain measures or actions need to be taken. If you are continually improving your own NPS, then you’re likely to be continually improving your customer satisfaction, encouraging growth, and increasing revenue.
However, you should make sure that your pool of respondents is of a significant size to be able to draw accurate conclusions. Segmenting customers will prove useful in analyzing the results.
Factors affecting NPS benchmarks
So, which are the factors that affect NPS benchmarks? How do you know if you have a good NPS, and how do you know it’s not enough? Primarily, there are four factors that affect NPS benchmarks:
1. Niche Competition
Generally, NPS tends to be a better indicator in highly competitive verticals with many players, since it helps you assess relative performance. For instance, the reason why Tesla has an NPS of 96 can be partly due to its unique position in the market of luxury, long-range electric automobiles. As a result, customers have little choice, therefore are more satisfied.
Of course, there’s no denying that Tesla is making awesome electric cars and Elon Musk is building an aspirational brand, but NPS benchmarks tend to be higher for industries dominated by a bigwig with minor competition.
If you think it over, you’d realize that Apple doesn’t make the cheapest smartphones (they provide the best user experience); Netflix doesn’t offer a generic, free video streaming service (they provide a uniquely affordable, personalized and on-demand premium content streaming service); Amazon doesn’t lure customers with cheap discounts or flash sales all year round (instead, it locks them in by offering Prime benefits).
All these companies lead their market segment and have a unique, brag-worthy proposition. That’s the prime factor to consider while evaluating your NPS – how crowded your industry is and how unique your value proposition is.
2. Customer Tolerance Levels
Tolerance is one of the crucial factors that affect Net Promoter Score benchmarks, as people are more likely to be opinionated by how much value your products and services deliver to them on a day-to-day basis or how much their business or life depends on it.
You can measure the tolerance level for your business by asking a simple question: “On a scale of 0-10, how likely are your customers to get mad if you can’t address their needs on an immediate basis?”.
If the number is closer to 10, your business is in a low-tolerance industry toward service interruption, but if the number is close to 3-4, you’re in a high-tolerance industry.
The easiest way to increase the tolerance level for your company is to transform the customer experience by providing more customer touchpoints, greater transparency, and easier accessibility. Perhaps, the best examples of companies that have managed to achieve high tolerance, despite being in a low-tolerance industry, are Uber, Southwest, and Netflix.
3. Vendor Switching Barriers
One of the reasons why non-SaaS businesses tend to fetch higher NPS than SaaS ones is because it’s easier to infuse brand loyalty and high tolerance, as they have inherently high switching barriers.
For instance, if you bought a car and loved the driving experience, you are inclined toward recommending it to your friends, even if the car gave you a little trouble over time. It’s partly confirmatory bias, but mostly high switching barriers.
You cannot afford to switch to a different brand without taking a financial hit. So, in order to stay consistent with your original conviction, you maintain a strong bias and keep referring the brand to others.
However, what would be the case if you rented the car? Switching barriers would be relatively low since you can easily rent a different one to see how it performs.
That’s exactly the kind of problem that SaaS businesses face. Usually, SaaS companies have an inherently low entry and exit barrier, thus, making it difficult to retain customers and build loyalty. That’s also one of the major reasons why most SaaS companies have an NPS in the mid-tier range.
Speaking of SaaS businesses, there is another important aspect impacting their NPS score to take into account, namely: the role and stage in the customer life cycle.
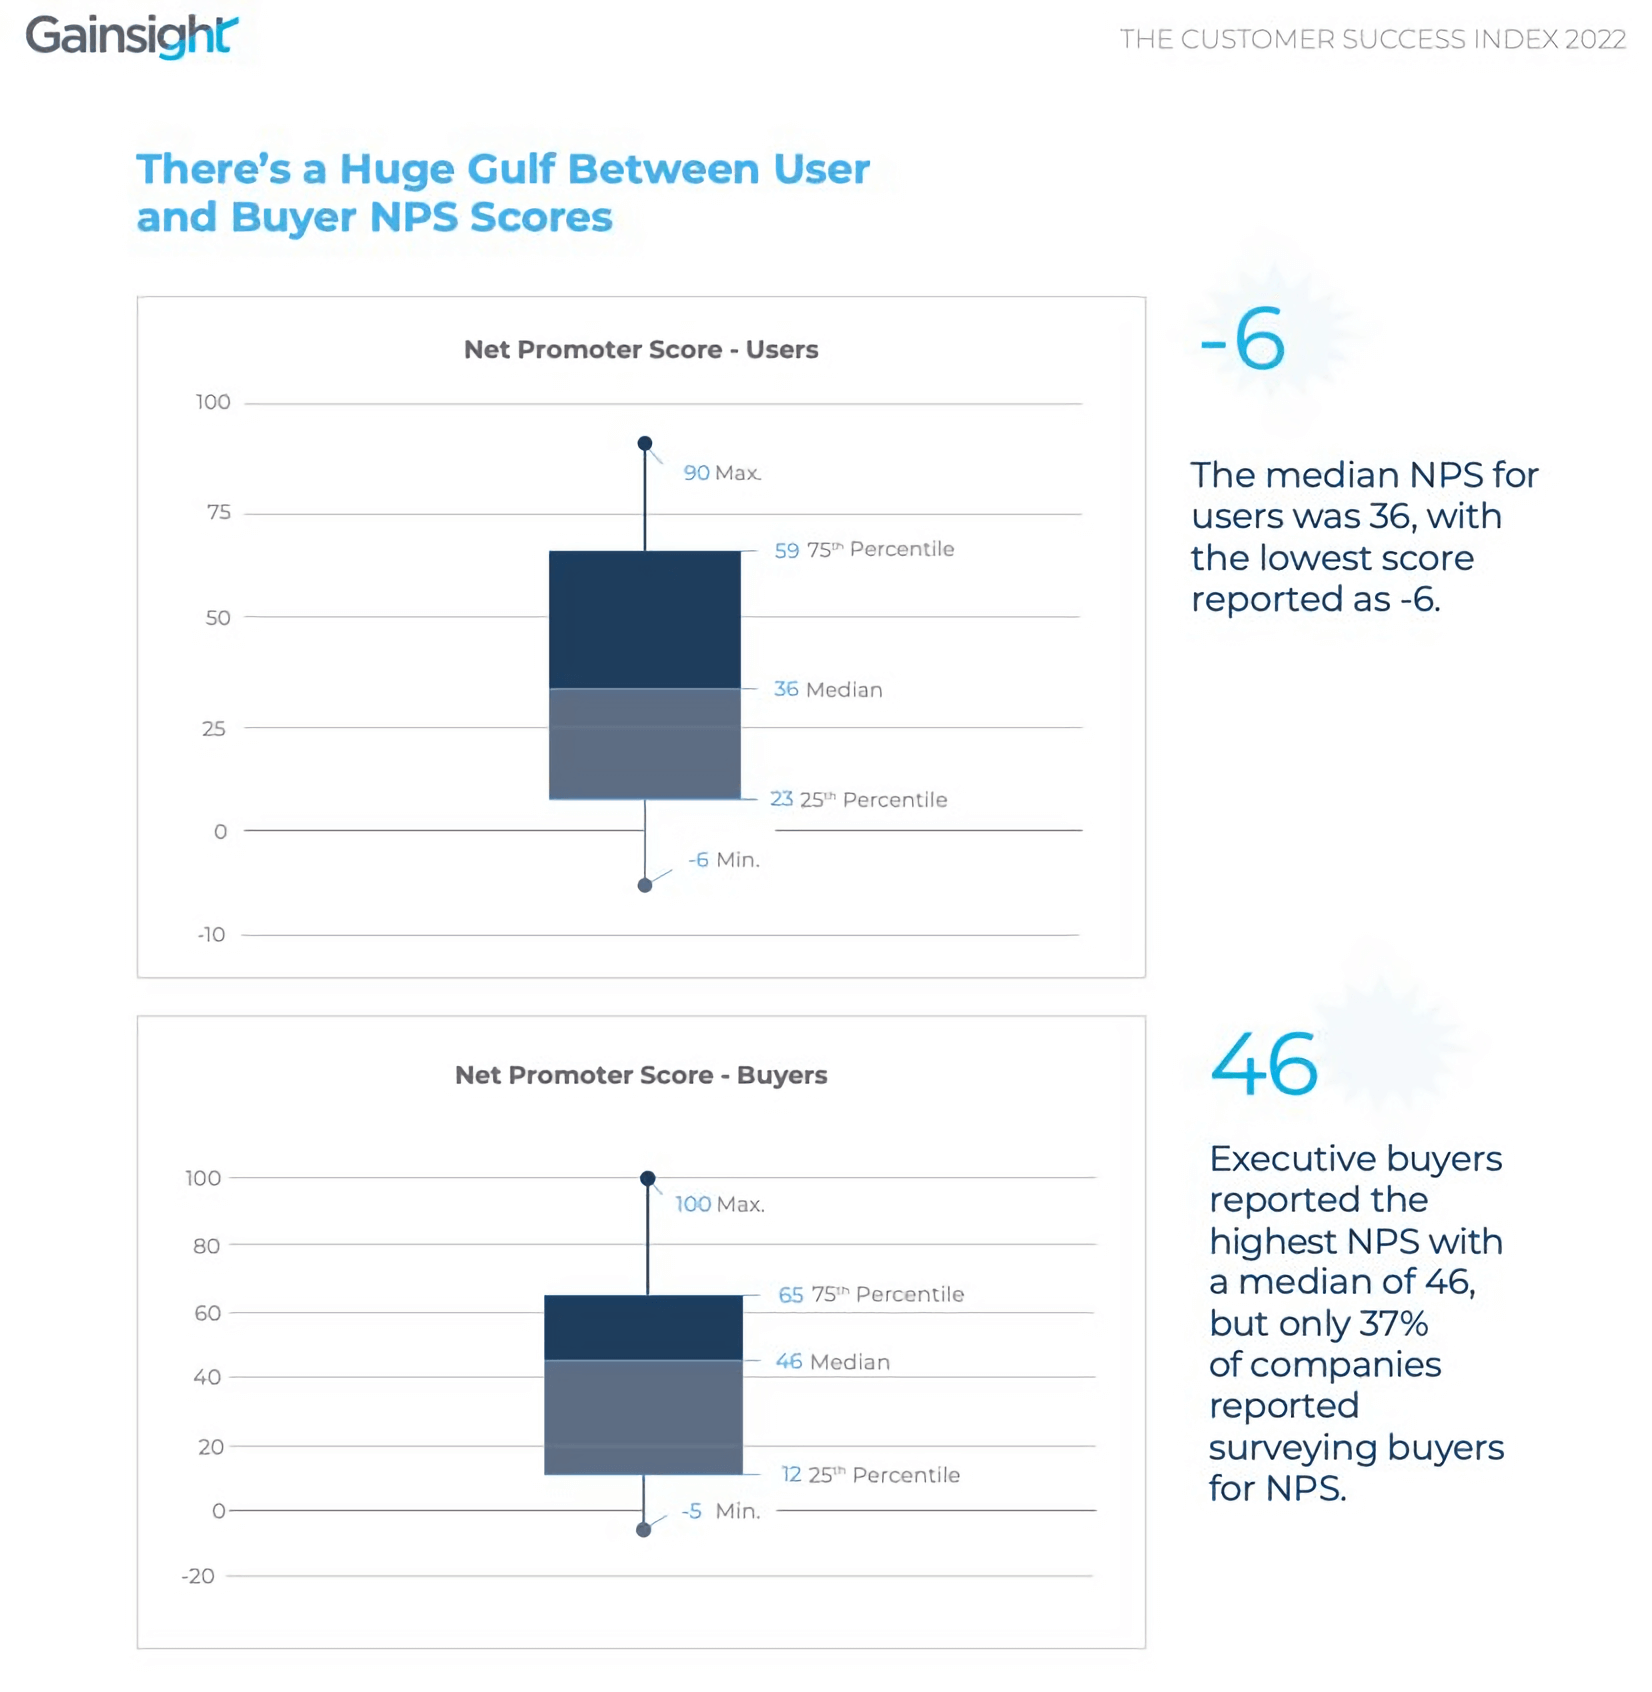
The Gainsight’s Customer Success Index 2022 showcases a clear Net Promoter Score gap between users – with a median of 36 – and executive buyers or key decision-makers, having an average NPS of 46.
The surfaced data clearly shows that buyers are very often more satisfied with the software purchase than the users who actually interact with the tool throughout their journey. While the decision-makers are there to offer the necessary instruments to the team, they are very often on the outskirts of the actual user experience.
At the same time, as the user gets accustomed to the new product and learns about its subtleties, their NPS score streams confidently up. Hence the user’s NPS score tends to depend on how quickly they manage to adopt the new instrument, while the buyer’s score depends on how fast he switches to a new project or a new productivity tool.
And while the feedback from both perspectives is extremely important, this data outlines the importance of looking at NPS not as a one-off survey, but as a sustainable process that keeps a pulse on customer engagement.
4. Events of global significance
Timing is important in benchmarking: certain events, global or local, may influence results significantly as customer interests and expectations change.
Though events of global significance are rare, they do happen and impact the NPS. The COVID pandemic has become a challenge for many businesses leading to a notable decrease in survey scores. A Qualtrics study showcases that the average NPS dropped by 15,2 points during the pandemic, that is from 29.8 to 14.6, with younger people giving lower scores.
Moreover, the NPS dropped more than 30 points with the youngest age group as compared to the oldest one (55 and older), which declined by only 3.2 points. The obvious reason behind such a striking difference is that the first are active users of digital products, which as a rule provide faster service, thus expectations are rather high.
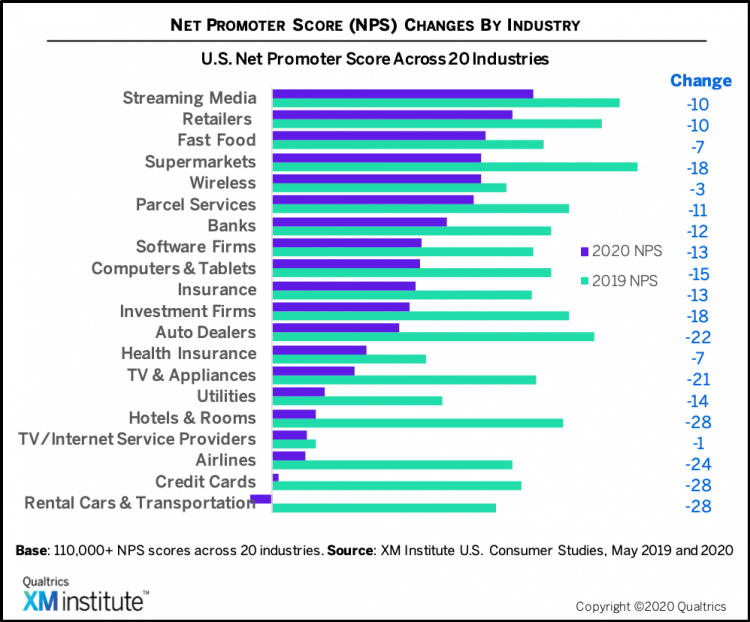
Industries affected by the travel restrictions, like rental cars and transportation, hotels, credit cards and airlines, showed the biggest decline and the lowest NPS scores: their NPS went down by 24-28 points. The least affected industries were health insurance, fast food, wireless carriers and TV/Internet service providers.
Since most services and products had to be digitized, many companies were not ready to deal effectively with the new reality. Initially, this led to slow processing, long waiting times, bugs, and errors that impacted overall customer satisfaction.
Still, human emotions shouldn’t be discarded. There are claims that at the very beginning of the pandemic, many people were more tolerant of long waiting times and glitches. That was bound to end in a while, as customers became willing to get back to the performance they were used to. This shift in emotions should, however, also be considered when benchmarking the score.
NPS as a driver for feedback
Ask yourself, if you find out in your benchmarking process that your score is lower than your competitors’, will you stop attempting to improve it? And on the flip side, if you learn that you are doing better than your competition, will you stop then?
While most businesses are obsessed with growing their score, NPS is not really a quantifiable metric to merely grow, but mostly a qualitative metric to reflect, analyze and react.
The most important aspect of NPS that many companies miss is that the number is just a metric; what’s more important is the qualitative feedback you get from it and what you do with it to make sure you’re improving your customer experience.
The main purpose of the Net Promoter Score lies in helping you track and maintain the relationship you’ve created with your audience. And your main goal should always be to listen to the voice of your customers and act on it.
Instead of asking “What is a good Net Promoter Score?”, focus on understanding what drives the score and how to improve it day in and day out, month in and month out, to produce long-term customer success.
Start measuring your Net Promoter Score today and look into the score insights, instead of interpreting it at its face value.
More data is not necessarily better data without proper interpretation, but having the right tool at hand, you might also want to look into additional customer satisfaction metrics, like CSAT or CES, for another perspective on your transactional processes.


 Greg Raileanu

 Christina Sol


 Alex Bitca

